Dividend growth to slump to lowest rate in a decade in 2020
The FTSE's predicted 2020 payout figure represents growth of just 1.8% from this year’s expected £89…
18th December 2019 15:09
by Tom Bailey from interactive investor
Share on
The FTSE's predicted 2020 payout figure represents growth of just 1.8% from this year’s expected £89.5 billion.

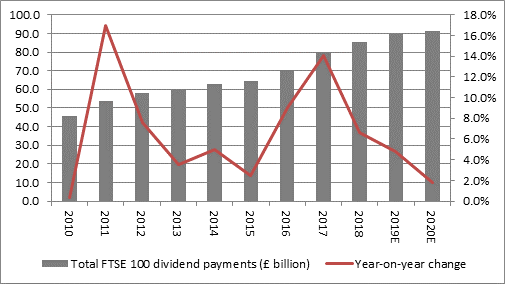
The FTSE 100 is expected to hand back a record amount of dividends to investors next year, according to AJ Bell’s latest figures. But there’s a sting in the tail, in that dividend growth will slump to its lowest rate in a decade.
According to the AJ Bell’s latest Dividend Dashboard report, the blue-chip stock index is expected to see dividend payments grow, producing a yield of 4.7% in 2020. That would bring the total amount paid out by the index to a record £91.1 billion, above what the FTSE 100 is expected to pay in 2019.
However, the predicted 2020 payout figures represents growth of just 1.8% from this year’s expected £89.5 billion. If both predictions are correct, that would represent the lowest rate of growth since 2009 and 2010.
However, when looked at in terms of yield, the index is still paying out generous amounts. But how safe is that yield?
According to Russ Mould, investment director at AJ Bell, dividend payments are forecast to be very concentrated in 2020. He points out that just 10 stocks are expected to generate more than 98% of the increase in dividend payments in 2020.
Mould continues: “The biggest increases in sterling terms are expected from British American Tobacco and RBS. In total, three of the ten biggest dividend hikes are forecast to come from banks (RBS, Standard Chartered and Barclays), two from consumer staples giants (BAT and Unilever) and one from asset manager and recent market joiner M&G.”
Dividend cover for 2020, however, looks slightly improved. Compared to 2019’s expected 1.62x, the index is forecast to have a dividend cover of 1.69x in 2020.
That, however, is still way below the 2x, the ideal level for dividend investors.
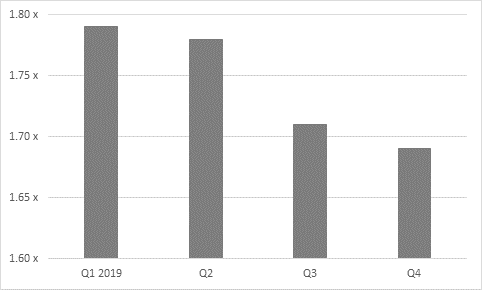
At the same time, Mould points out that dividend cover is lower than previously forecast. He says: “At this time one year ago, analysts were forecasting dividend cover of 1.79 times for 2020. But since then aggregate net income forecasts have dropped by £13.3 billion, or 5.6%, while aggregate dividend payment estimates have been cut by just £3.3 billion, or 3.5%.”
Forecast earnings cover for 2020 throughout the year
Across the whole index, companies have largely been reluctant to cut their dividend so far. Mould puts this down to companies being aware of the importance of dividends in today’s low-interest rate world and the need to accommodate investors looking for yield.
But, Mould warns: “Management must be careful that they are not over-paying and under-investing to curry short-term favour to the long-term detriment of their business’ competitive position and therefore its ability to generate cash and offer dividends.”
Top 10 dividend payers
At the same time, the companies with the 10 largest forecast yields have an even lower dividend cover, an expected 1.44x.
Of the ten largest dividend payers, only M&G has a dividend cover ratio above 2x. The second-best dividend cover is Aviva, at 1.84x.
According to Mould, “The lowly earnings cover partly reflects the lofty expected pay-outs at a trio of house builders, Taylor Wimpey, Barratt Developments and Persimmon. The good news is that all three have net cash balance sheets with which to reassure shareholders, even if earnings cover looks lower than ideal.”
Standard Life Aberdeen has the worst forecast dividend cover, at 0.87x. A dividend cover below 1x means a company has to fund part of its dividend payments with something other than earnings – typically debt.
| Dividend yield (%) | Dividend cover (x) | |
|---|---|---|
| Imperial Brands | 12.2% | 1.32 x |
| Taylor Wimpey | 10.6% | 1.11 x |
| Evraz | 10.5% | 1.55 x |
| Persimmon | 9.3% | 1.14 x |
| M & G | 8.5% | 2.09 x |
| Aviva | 8.2% | 1.84 x |
| British American Tobacco | 7.5% | 1.53 x |
| Standard Life Aberdeen | 7.1% | 0.87 x |
| HSBC | 7.1% | 1.38 x |
| Barratt Developments | 7.1% | 1.54 x |
| AVERAGE | 8.8% | 1.44 x |
Why does dividend cover matter?
A key indicator of dividend sustainability is dividend cover. This is considered an important metric in assessing whether a company is in a healthy position to distribute the level of dividends it proposes to. The metric is calculated by dividing earnings per share by dividend per share.
As a rule of thumb, a low dividend cover score – of around one times or lower – suggests that dividends are vulnerable, as the company is using most, if not all, of its profits to fund its dividends. A figure of two or more times is viewed as comfortable, because it is a sign that a business is not over-distributing
This article was originally published in our sister magazine Money Observer, which ceased publication in August 2020.
These articles are provided for information purposes only. Occasionally, an opinion about whether to buy or sell a specific investment may be provided by third parties. The content is not intended to be a personal recommendation to buy or sell any financial instrument or product, or to adopt any investment strategy as it is not provided based on an assessment of your investing knowledge and experience, your financial situation or your investment objectives. The value of your investments, and the income derived from them, may go down as well as up. You may not get back all the money that you invest. The investments referred to in this article may not be suitable for all investors, and if in doubt, an investor should seek advice from a qualified investment adviser.
Full performance can be found on the company or index summary page on the interactive investor website. Simply click on the company's or index name highlighted in the article.