Three ways to spot whether a stock market is ‘truly cheap’
The UK stock market has been described as cheap for several years - but it’s not as simple as that, sa…
27th November 2019 14:05
The UK stock market has been described as cheap for several years - but it’s not as simple as that, says Tom Bailey.

For the past three years, readers of the financial press will have heard countless times that the UK stock market is ‘cheap’. Investors fearing the worst outcome from Brexit, as well as the potential of a Labour government coming to power, have turned their backs on UK shares, pushing the market to supposedly attractive valuations for the more contrarian-minded. This is certainly the view of Richard Staveley, a fund manager at Gresham House Strategies. He says: “Compared to other established markets globally, the UK looks the cheapest on a relative basis.”
But what does it actually mean to say that the UK is cheap? As with individual stocks, there are multiple ways by which to judge the value of a market. We take a look at some of the considerations investors need to take into account when trying to gauge how cheap a market is.
A popular way to gauge the ‘cheapness’ of a market is to look at its price-to-earnings ratio. The p/e ratio is the share price of a company divided by the company’s annual earnings per share. This can then be applied to the market as a whole, using average price and earnings values.
The UK’s FTSE 100 currently has a p/e ratio of around 15 times, at the time of writing (late October). Is the UK cheap on this basis? Compared to other markets around the world, not particularly. Russia, one of the cheapest in the world, currently has a P/E of around 5 times. China’s is 9.8 times, South Korea’s is 12.7 times, and Italy’s is 13.7 times.
- ETF portfolio: finding value in the world’s cheapest stockmarkets
Price-to-earnings ratio
Compared against those markets, the UK could appear expensive. But then compared to other markets it could be argued that the UK is cheap in p/e terms: Germany is on 18 times, the US 21 times, and India a whopping 27 times.
The first point is that comparing some markets directly does not always make sense. Each market has its own characteristics. Christopher Gannatti, head of research for Europe at WisdomTree, points out: “If a given market has a lot of earlier stage companies in technology, price-to-sales might be better than price-to-earnings.”
Similarly, it could be argued that India’s worryingly high p/e ratio is the result of investors pricing in strong future growth, with the country expected to be the ‘next China’.
Any attempt to gauge cheapness of a market based on p/e requires more context. Historical figures can often provide this, and on this front, the p/e ratio for the UK is not that out of sync with historical averages. As Job Curtis, manager of City of London Investment Trust, says: “The p/e ratio for the UK equity market [the FTSE 350] is in line with the long-term average going back to 1993.”
Yields
Another way to determine the value of a market is to look at the yield. According to Staveley: “The UK market dividend yield of 4.6% [late October] stands out as bargain basement when compared to all asset classes and markets, if it can be sustained.”
As dividend is calculated by dividing the annual dividend by the current share price, a higher yield can indicate two things: low stock prices or a generous dividend policy. It can also indicate both. Compared to other markets around the world, the UK’s yield is highly attractive. That said, the UK has historically been a generous dividend payer, so it makes sense to compare today’s current yield relative to history.
On this measure, the FTSE 100’s current yield of 4.8% is attractive, because over the past 30 years its average dividend yield has been 3.3%, according to John Kingham of research website UK Value Investor.
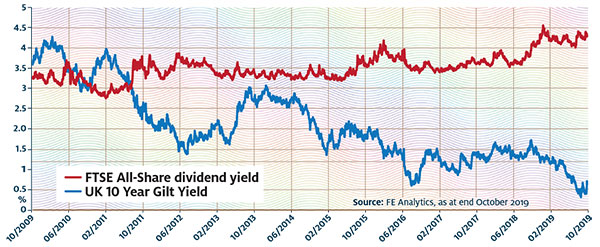
The FTSE All-Share yield is increasingly enticing
This article was originally published in our sister magazine Money Observer, which ceased publication in August 2020.
These articles are provided for information purposes only. Occasionally, an opinion about whether to buy or sell a specific investment may be provided by third parties. The content is not intended to be a personal recommendation to buy or sell any financial instrument or product, or to adopt any investment strategy as it is not provided based on an assessment of your investing knowledge and experience, your financial situation or your investment objectives. The value of your investments, and the income derived from them, may go down as well as up. You may not get back all the money that you invest. The investments referred to in this article may not be suitable for all investors, and if in doubt, an investor should seek advice from a qualified investment adviser.
Full performance can be found on the company or index summary page on the interactive investor website. Simply click on the company's or index name highlighted in the article.
Editor's Picks